What does the red plot points mean in the line graph and how do I find the data to enter in the cut estimator? Sorry, it’s not obvious to me.
Joe Lee Answered question
The red point appear when you refresh the graph. They are the points (diamonds) you’ve already clicked on that show up in the history list below the plot.
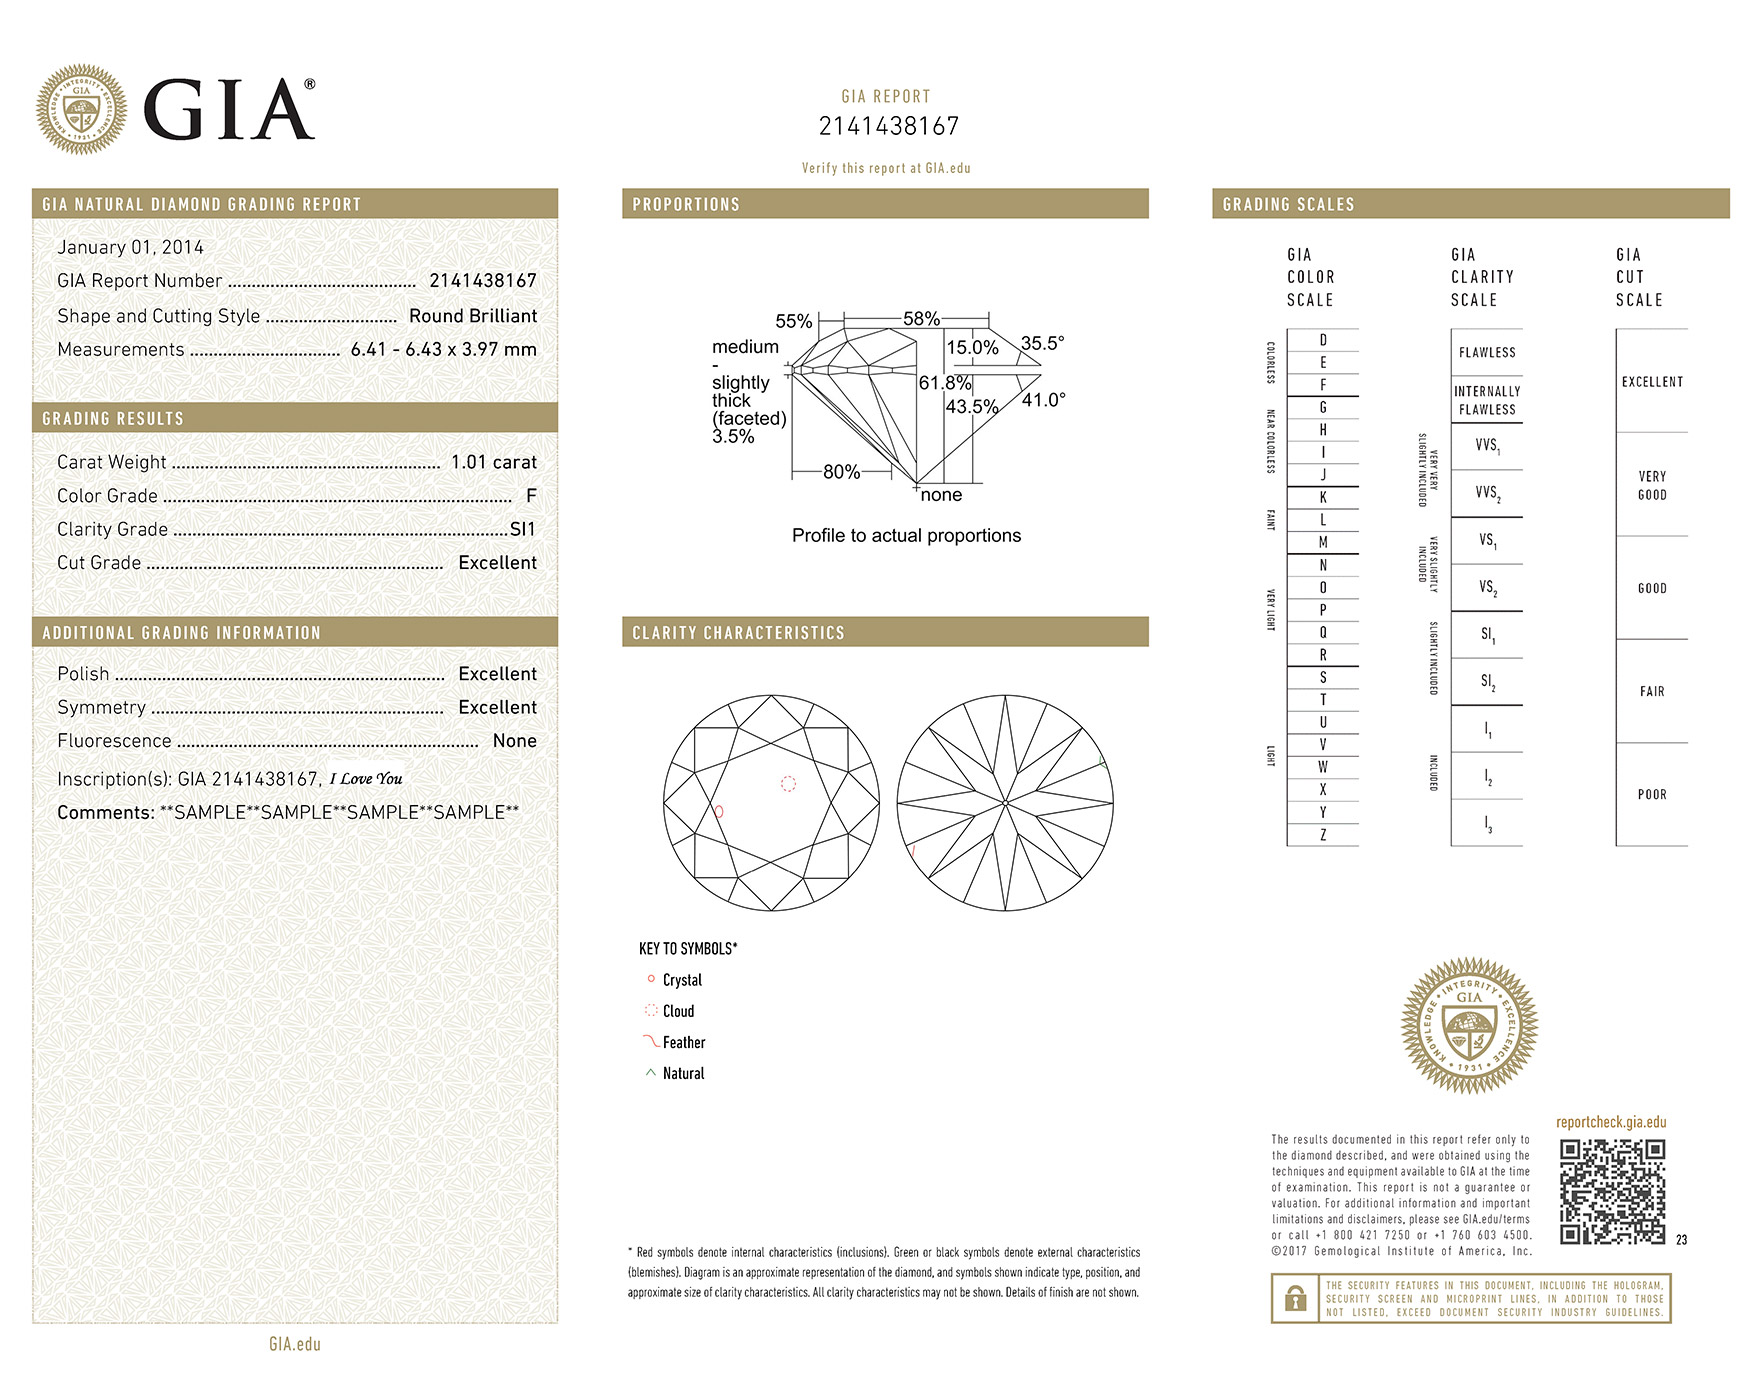
For the cut estimator, the data comes from the grading report. For GIA reports, there’s a proportions diagram. In the sample grading report below, the table % is 58%, the crown angle is 35.5, and the pavilion angle is 41. If it’s from another grading lab, those numbers are either listed directly or are also shown in a similar diagram.
Joe Lee Answered question
Write your answer.