| Depth | 60-63% |
| Table | 56-60% (table % ≤ depth %) |
| Length/Width Ratio | 1.37-1.55 |
Searching for oval diamonds using these criteria will enrich your results for well-cut diamonds with an optimal profile and spread. We automatically highlight such diamonds in our price curves to make the search process easier.
Motivating Example
If you’re just starting your research, GIA has an excellent introduction to oval diamonds. They explain the anatomy of an oval and concepts like length to width ratio, shape (flat vs. bulging shoulders), and bow-tie effect. Start there before proceeding further.
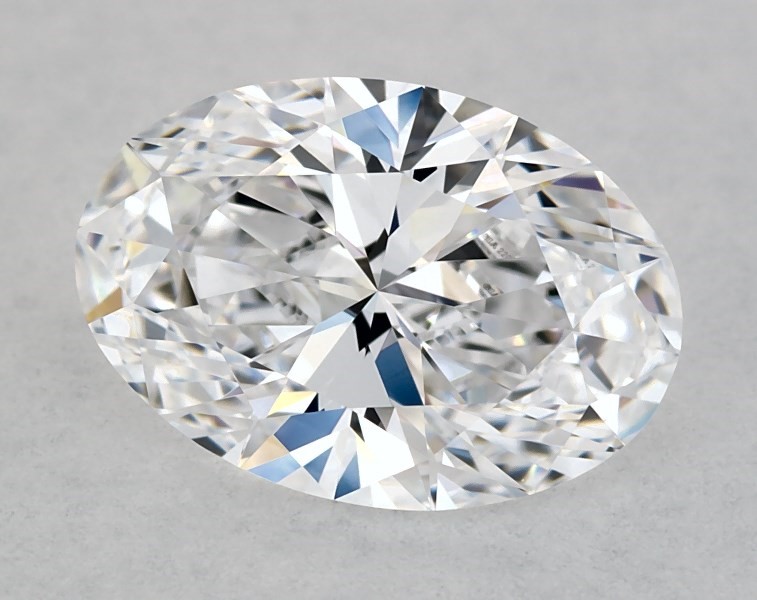
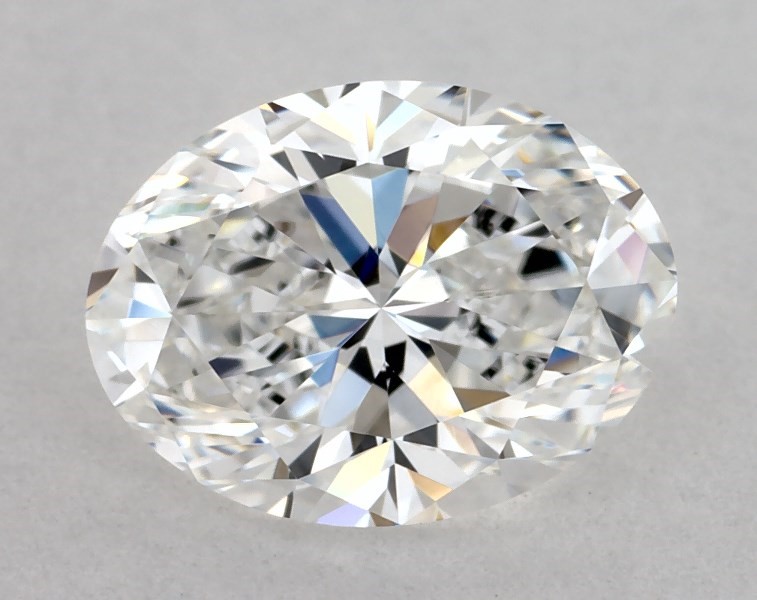
Both of the diamonds below satisfy GIA’s criteria and show nice light performance. The 1.01 D VVS2 follows our recommended proportions while the 1.02 E VVS2 does not. Although they are essentially the same carat weight, the 1.01 D VVS2 is 0.7mm longer than the 1.02 E VVS2. The 1.02 E VVS2 has a higher depth; it hides carats vertically where you can’t see them, resulting in a smaller looking diamond.
Use the variation in proportions to your advantage – maximize visual size, not carats.
Recommended Proportions
- 1.01ct D VVS2
- Depth 62.7%
- Table 57%
- L/W Ratio: 1.45
- Spread: 8.13×5.61mm
Other Proportions
- 1.02 E VVS2
- Depth 64.4%
- Table 62%
- L/W Ratio: 1.33
- Spread: 7.43×5.58mm
Depth and Table
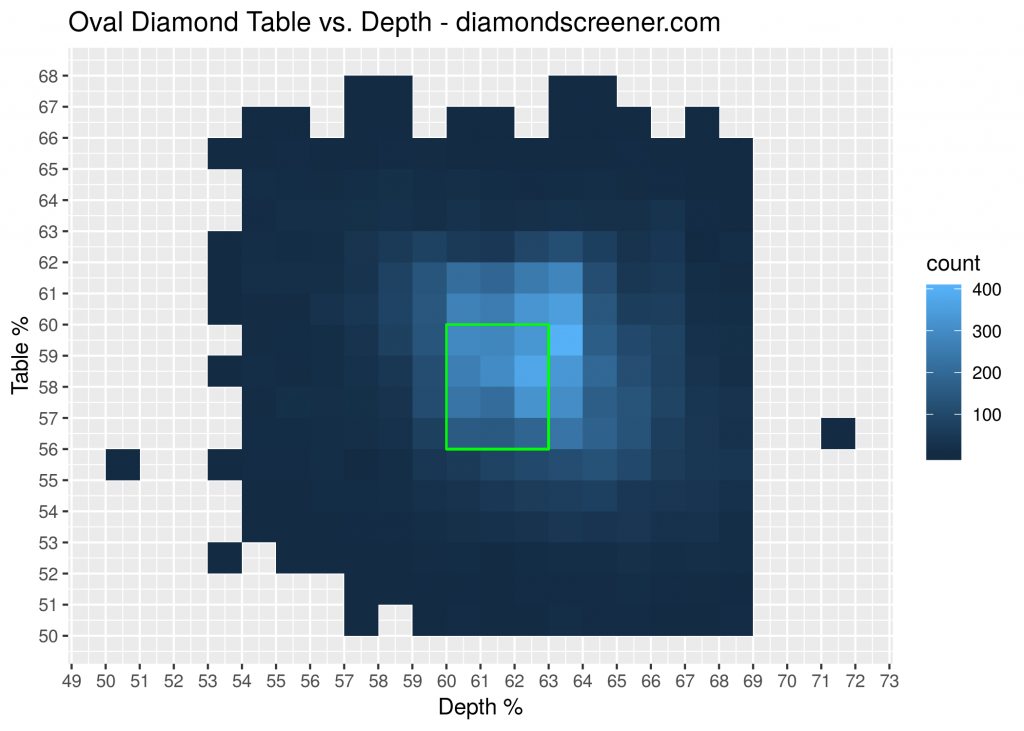
Ovals aren’t assigned a cut grade by any of the major grading labs. Although oval diamond proportion recommendations are available on other sites, none of them explain why their ranges are valid. Here, we use data to support our recommendation of depth 60-63% and table 56-60%.
Below is a heatmap showing the counts of all depth and table combinations for oval diamonds available online at James Allen and Blue Nile. Brighter blue indicates more diamonds having that specific depth and table combination. Based on the heatmap, diamond cutters seem to prefer a depth range of 60-64% and a table range of 56-62%.
Our recommended range of depth 60-63% and table 56-60% is highlighted in green. Why is do we recommend a tighter range than the most common depth and table combinations?
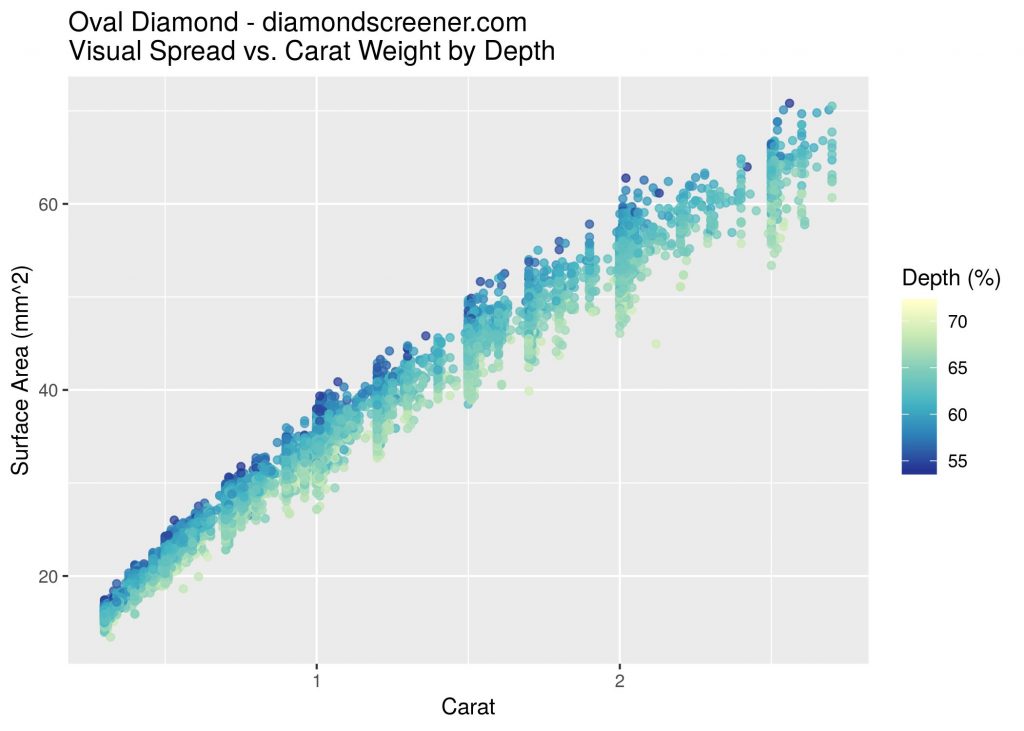
Let’s introduce the idea of visual spread. Visual spread is a diamond’s observable size, defined as the surface area of the diamond’s outline. Diamonds with higher surface areas will look bigger.
The formula for the surface area of an oval is pi * (length / 2) * (width / 2). In the graph below, we’ve plotted the surface area of oval diamonds vs. their carat weight, color coded by their depth %. For the same carat weight, lower depths in blue have higher visual spreads compared to higher depths in yellow.
A shallower diamond with lower depth has a larger visual spread because the carats are distributed horizontally rather than vertically. However, if a diamond is too shallow it will leak light through the bottom of the diamond.
Our depth recommendation of 60-63% stays within the diamond cutter’s sweet spot for light performance (avoiding the too shallow diamonds that leak light). It favors visually larger diamonds by removing the 63-64% depth diamonds that may have been cut to increase carat yield from rough.
Our table recommendation of 56-60% similarly stays within the diamond cutter’s preferred proportion range, but avoids the largest tables in order to preserve crown height and maximize fire. This is similar to our discussion of crown height for princess diamonds.
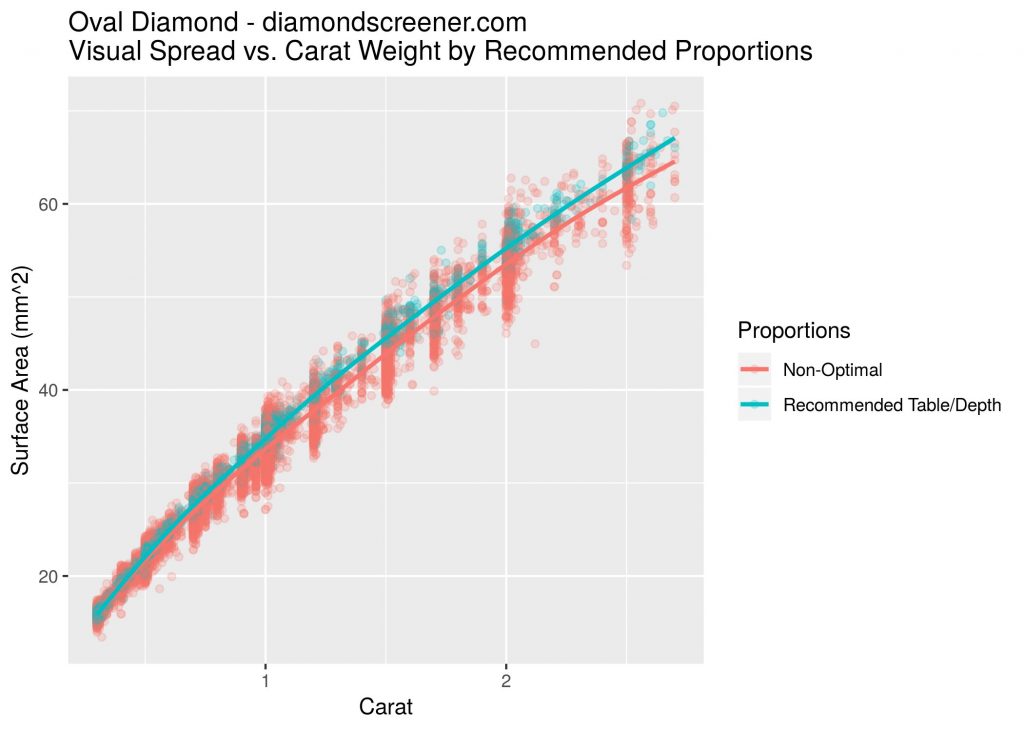
Putting all of this together, the graph below plots the average surface area for a diamond that fits our recommended proportions vs. all other diamonds that do not. For diamonds greater than 0.75ct, our proportions result in diamonds that are about 3% bigger on average for the same carat weight. Note that the non-optimal average is inflated by the low-depth diamonds that leak light, so this difference is underestimated. An extra 3+% difference might not sound like much, but that’s worth a lot of money when you consider diamonds cost thousands of dollars.
Length/Width Ratio
Length/width ratio is another factor that determines visual size. Longer diamonds look bigger because length catches your eye.
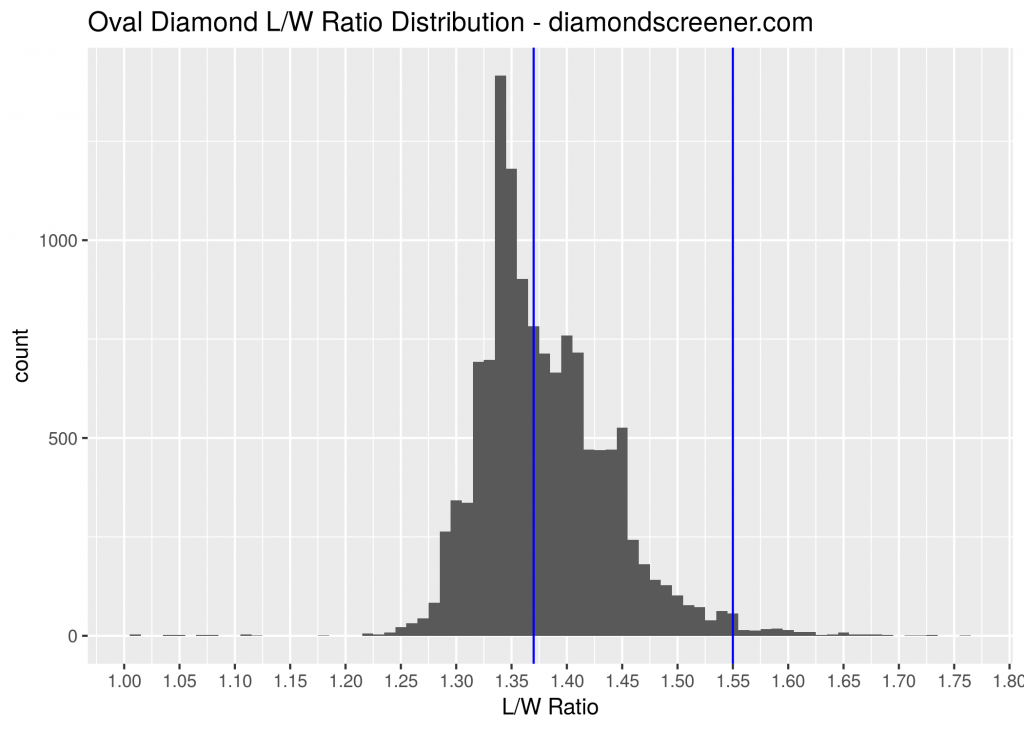
Below is a histogram showing the L/W ratio distribution for oval diamonds from James Allen and Blue Nile. Our recommended range of 1.37-1.55 lies between the blue bars. The median L/W ratio is 1.37. Thus, we are recommending diamonds that are longer than average.
We make this recommendation based on a GIA study of consumer preference.
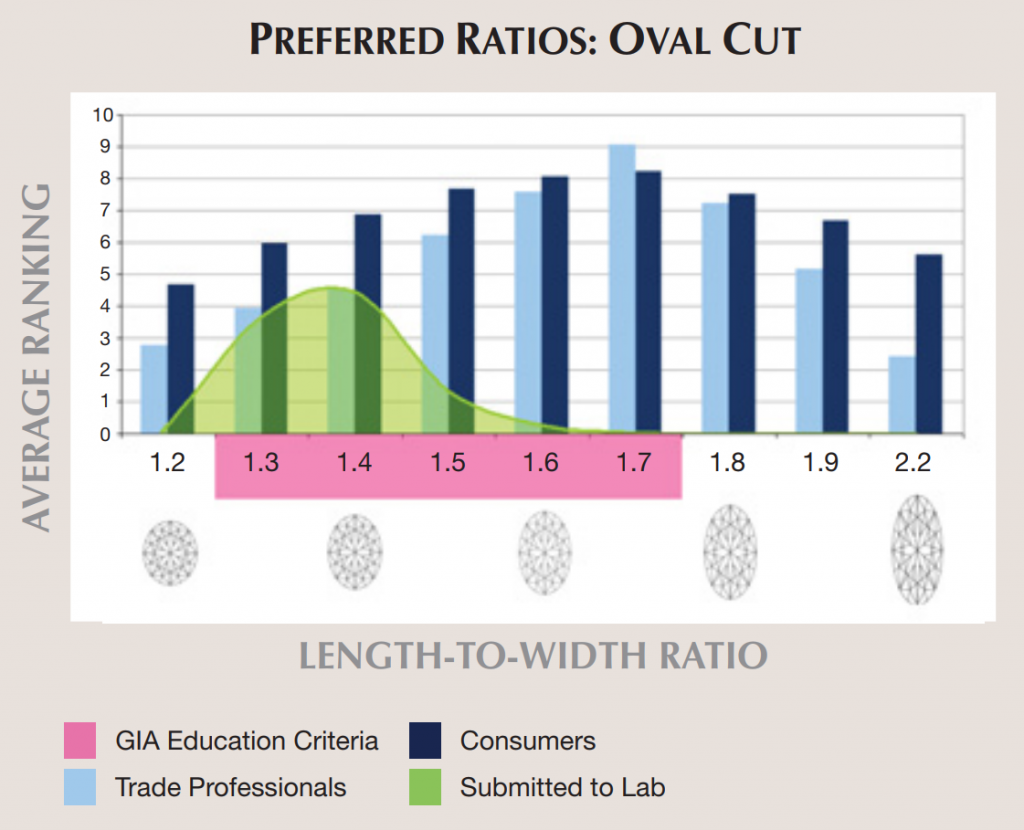
GIA conducted a survey in 2009 to assess personal preferences in the length-to-width ratios of fancy shapes. Images of four shapes—emerald, pear, marquise, and oval—with various lengths and widths were presented to 19 trade professionals and 25 consumers. The opinion results were compared to the “best” ratios taught by GIA educators and the distribution of length-to-width ratios of diamonds submitted to the GIA’s laboratory. Overall, consumers and trade professionals preferred narrower shapes than those being submitted to the lab.
GIA Abstract: Length-to-with Ratios Among Fancy Shape Diamonds
The graph below comes from GIA’s abstract. Consumers (dark blue) and trade professionals (light blue) both gave higher rankings for higher L/W ratios.
The main limitation of this study is that it asked about the outline of the shapes, not actual cut diamonds. The L/W ratio distribution of cut diamonds submitted to GIA (green) is similar to the histogram above.
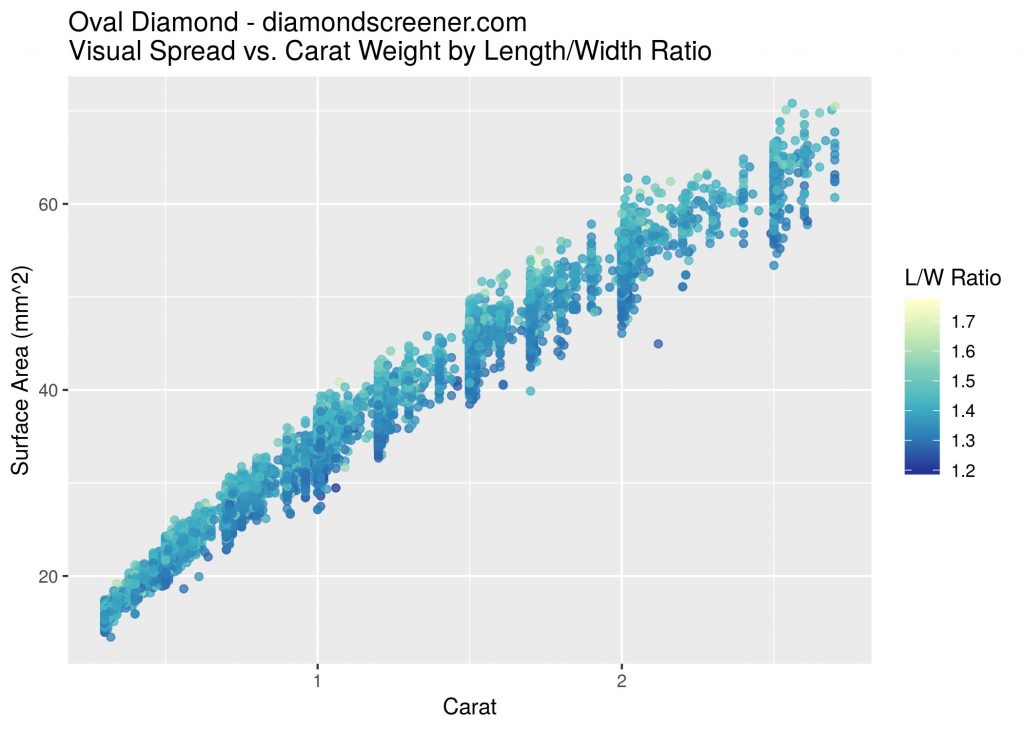
Diamonds with higher L/W ratios tend to have higher visual spread, shown in the graph below. This is similar to depth, but the relationship is not as strong.
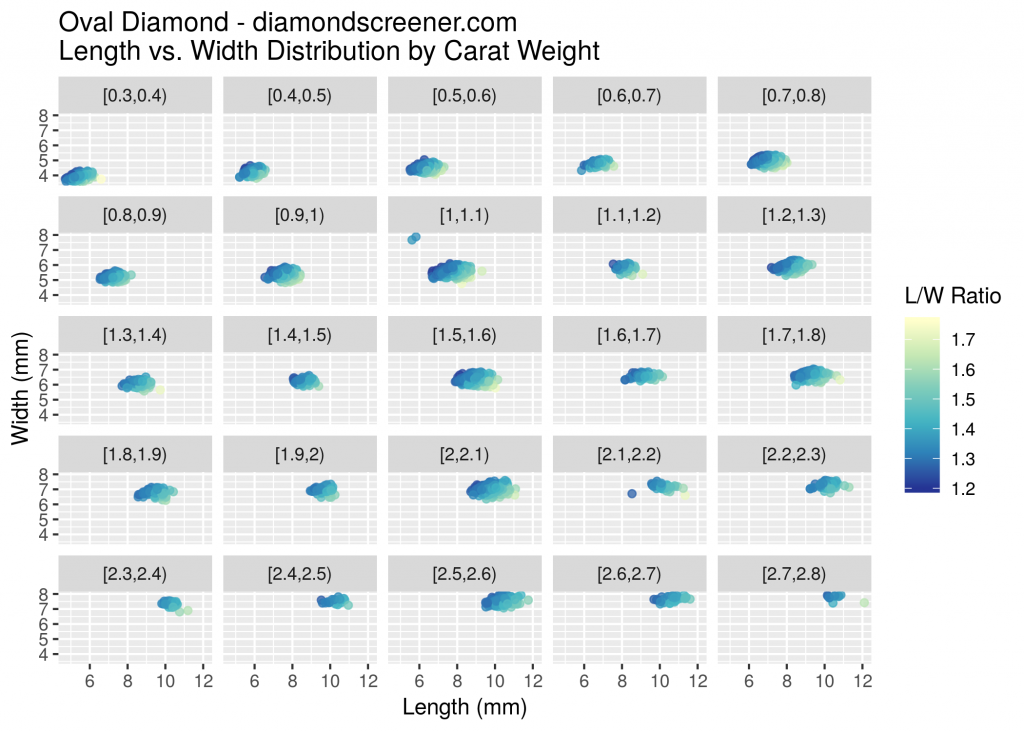
On a more granular level, the figure below shows the width vs. length distribution for each carat weight category, color coded by L/W ratio. In this figure, you can see that a 0.9ct oval with a higher L/W ratio can look bigger than a 1ct oval with a lower L/W ratio.
Buying a 0.9ct diamond with optimal proportions and the same visual size of a less well-cut 1ct diamond would result in better light performance and significant savings. When evaluating ovals it’s important to check its dimensions in mm, not just the carat weight. Don’t pay for carats you won’t see.
If a beautiful diamond could be cut to any length to width ratio, longer would be preferred by consumers. Longer L/W ratios increase the visual spread. Thus, we recommend diamonds in the upper half of the L/W ratio distribution.
Conclusion
Our depth and table recommendations are backed by an analysis of their effect on visual size. Our L/W ratio recommendations are backed by studies of consumer preference. Following these search parameters will enrich for well-cut diamonds that maximize value.