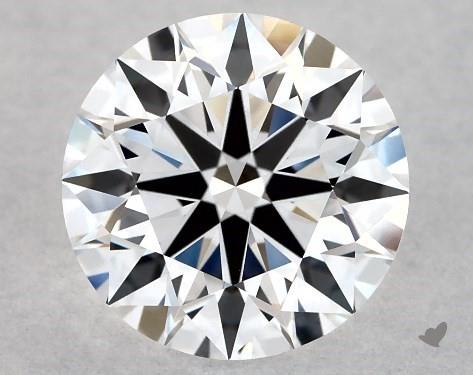
In our round diamond guide, we recommend buying a diamond that looks like the one below. A well-cut diamond will have symmetric, well-defined arrows and vice versa. Visual inspection of a diamond is sufficient to evaluate cut quality.
In this analysis, we describe how we trained a computer to mimic the judgment of the human eye. We used computer vision algorithms to evaluate the similarity between a diamond image and an ideal diamond template. We derived a similarity score and used it to classify whether a diamond is ideal in terms of proportions (defined by GIA and AGS proportion-based cut grade criteria) and optical symmetry.
We’ve implemented our computer vision-based classifier to identify well-cut diamonds from James Allen in our price curves.
Ideal Diamond
We chose this 1.14ct D VVS1 GIA triple EX diamond (GIA 2326021627) as our ideal diamond template image (Figure 1). With table 57%, crown angle 35 degrees, and pavilion angle 40.6 degrees, it sits at the center of AGS 0 Ideal (the intersection of the cutter and anti-cutter’s line from Figure 23 of AGS’ research paper). It has perfect optical symmetry with the arrows meeting to form an eight-point star in the middle of the table.
Similarity Score
We used computer vision algorithms to extract features from the ideal diamond template and each diamond’s image. We compared the features of each diamond with the ideal diamond template to generate an image similarity score.
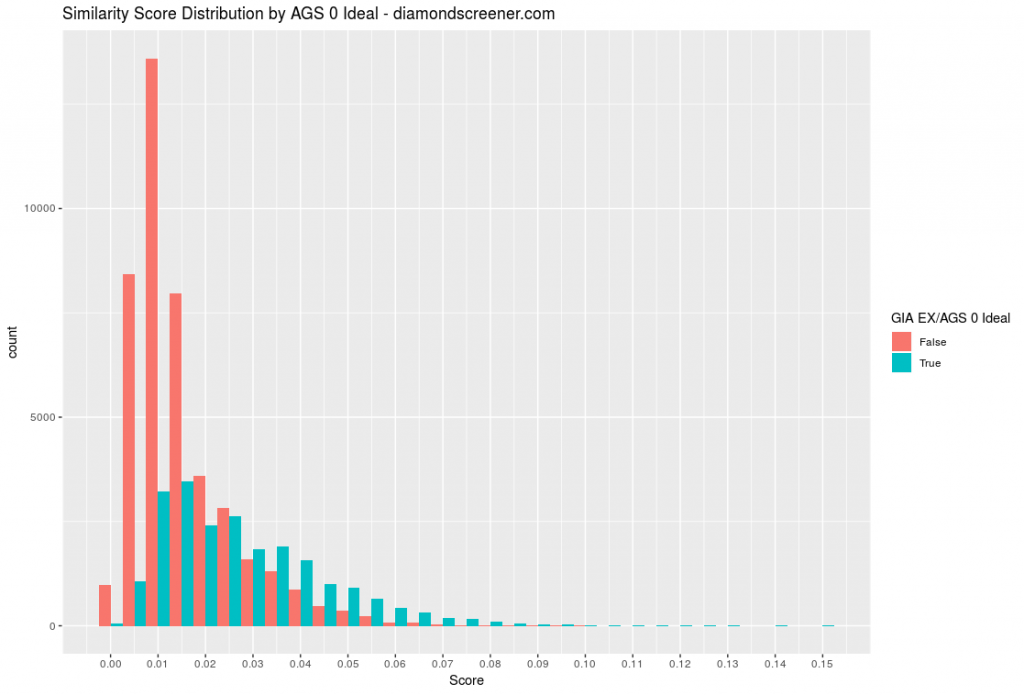
We generated similarity scores for the 64524 GIA EX 0.5ct+ round diamonds in James Allen’s inventory with available table, crown angle, and pavilion angle measurements. The distribution of the similarity scores are shown below in Figure 2.
For each diamond, we assign a “ground truth” label of whether or not it would qualify as GIA EX and AGS 0 Ideal based on its table, crown angle, and pavilion angle (proportion-based grading criteria visualized in our cut estimator). Our goal is to identify a score cutoff to classify whether a diamond has ideal proportions based on its image alone.
Classifier Performance
A common way to evaluate a model’s performance is a receiver operating characteristic (ROC) curve. A ROC curve sweeps through the range of discrimination thresholds (similarity score cutoffs) to show the trade-off between sensitivity (true positive rate) and specificity (1 – false positive rate). Moving up the ROC curve yields more true positives at the expense of more false positives. The ROC curve for our similarity score vs. AGS Ideal is shown below in Figure 3. The gray diagonal line represents a classifier that guesses at random; the black line represents the classifier based on our similarity score. A curve that’s higher and farther to the left is better.
The area under the ROC curve (AUC) is a summary statistic used to evaluate a model’s performance. It can be interpreted as the probability the model will score a randomly chosen positive class example (AGS Ideal diamond) higher than a randomly chosen negative class example (not AGS Ideal diamond). The AUC for a random classifier is 0.5, while a perfect classifier has a AUC of 1. Our model has a AUC of 0.752, high enough to be useful.
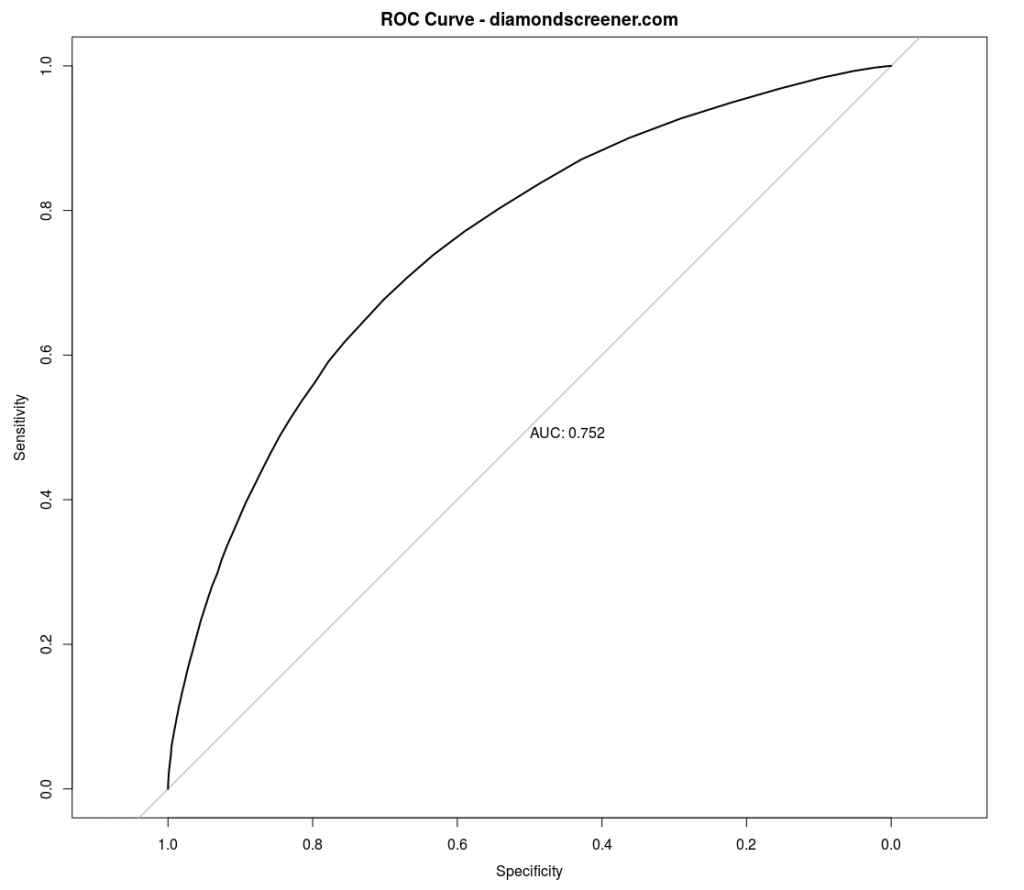
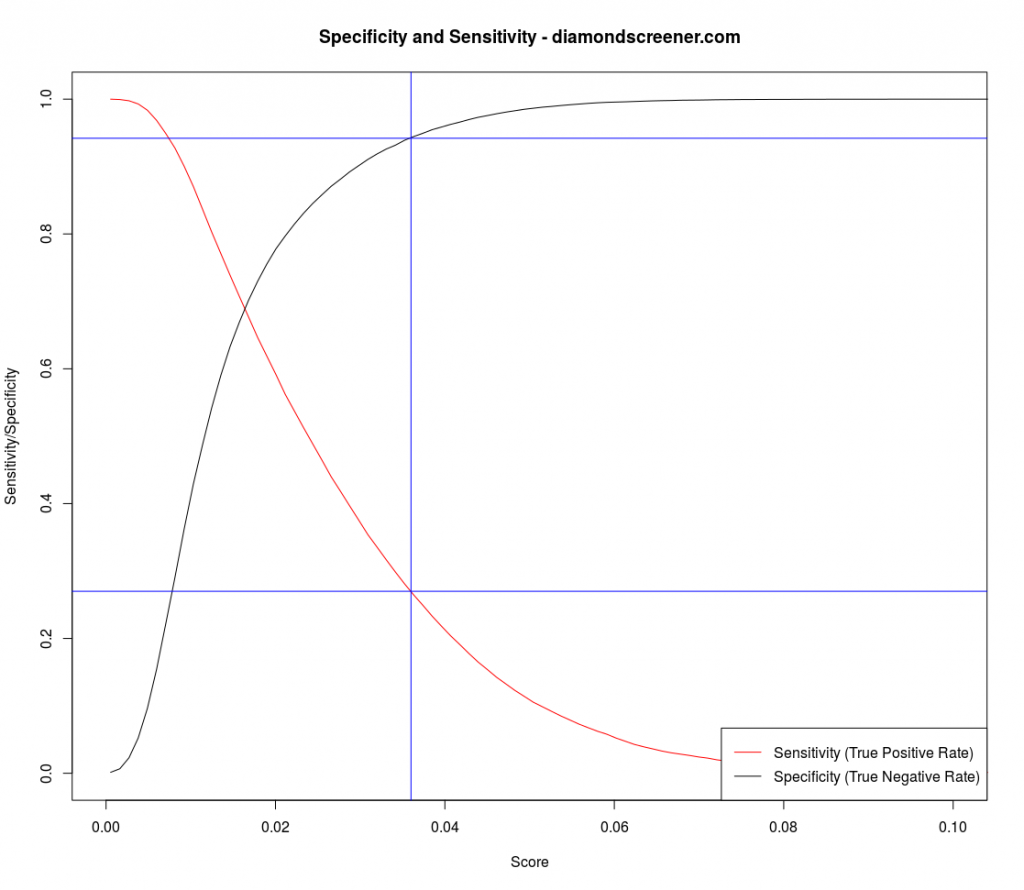
Figure 4 shows the sensitivity and specificity as a function of similarity score cutoff. For our classifier, we’ve selected a cutoff of 0.036 (vertical blue line), which yields a sensitivity of 0.26 and a specificity of 0.94 (horizontal blue lines). A 0.036 cutoff also corresponds to where the score distributions diverge for AGS 0 Ideal diamonds (see Figure 2).
We deliberately selected a cutoff with a high specificity (low false positive rate) at the expense of sensitivity (true positive rate). With tens of thousands of diamonds to choose from, it’s acceptable to miss some true positives because we would still identify thousands of other ideal diamonds. There would still be an abundance of choice. On the other hand, false positives (non-ideal diamonds) reduce the quality of the search results. We think a 1 out of 20 false positive rate is acceptable.
The sensitivity and specificity rates alone don’t tell the entire story. As we’ll see further below when characterizing classifier performance, many true positives we “miss” are AGS 0 Ideals with higher pavilion angles. These diamonds typically don’t show a strong arrows pattern. Therefore, our true positives enrich for AGS 0 Ideals that are closer to the sweet spot of the intersection of the cutter and anti-cutter’s lines. The false positives tend to be right outside of AGS 0 Ideal and typically show strong arrows, so they have high cut quality.
The confusion matrix below shows the results of applying our classifier to the full 64524 diamond dataset.
- The false positive rate is 2353 / (2353 + 40102) = 5.5%. That is, of the 42455 diamonds that did not have proportions that would qualify as AGS 0 Ideal, we classify 2353 of them as having ideal proportions.
- The true positive rate is 5833 / (5833 + 16236) = 26.4%. That is, of the 22069 diamonds that had proportions that would qualify as AGS 0 Ideal, we classify 5833 of them as having ideal proportions.
- The positive predictive value is 5833 / (5833 + 2353) = 71.3%. That is, of the 8186 diamonds that we classify as having ideal proportions, 5833 had proportions that would qualify as GIA AGS 0 Ideal.
| GIA/AGS – Not Ideal | GIA/AGS Ideal | |
| Similarity Score – Not Ideal | 40102 | 16236 |
| Similarity Score – Ideal | 2353 | 5833 |
Characterizing the Classifier
We plotted a heatmap visualizing the counts of the crown/pavilion angle combinations in each quadrant of the confusion matrix (Figure 5). The shape of the crown/pavilion angle combination distributions match the contour lines in our cut estimator. The full GIA EX range is shown in the upper left quadrant, while the narrower AGS Ideal range is shown in the upper right quadrant.
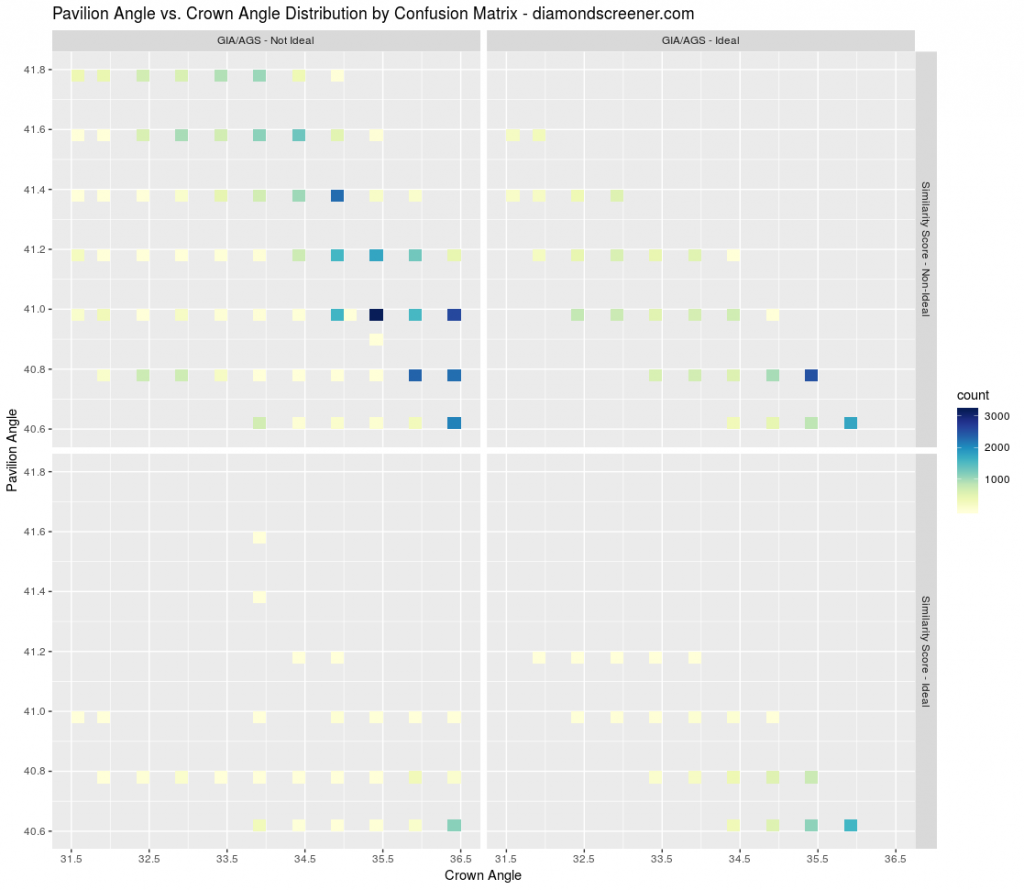
Figure 6 focuses on just the diamonds our classifier calls ideal.
- False positives (GIA/AGS not ideal, similarity score ideal) are shown on the left. The majority of the false positives are the 36.5/40.6, 36/40.8, and 34/40.6 crown/pavilion angle combinations. Diamonds with these angle combinations have AGS 1 EX proportions right outside of AGS 0 Ideal and typically show all eight arrows with good optical symmetry. Although they are false positives in terms of the AGS proportion-based grading criteria, these proportions would still make for nice diamonds with excellent light performance.
- True positives (GIA/AGS ideal, similarity score ideal) are shown on the right. Note the absence of the 41.4 and 41.6 pavilion angles compared to the full AGS ideal distribution. High pavilion angles tend to reduce the contrast of the arrows, so our classifier is excluding these higher pavilion angle diamonds.
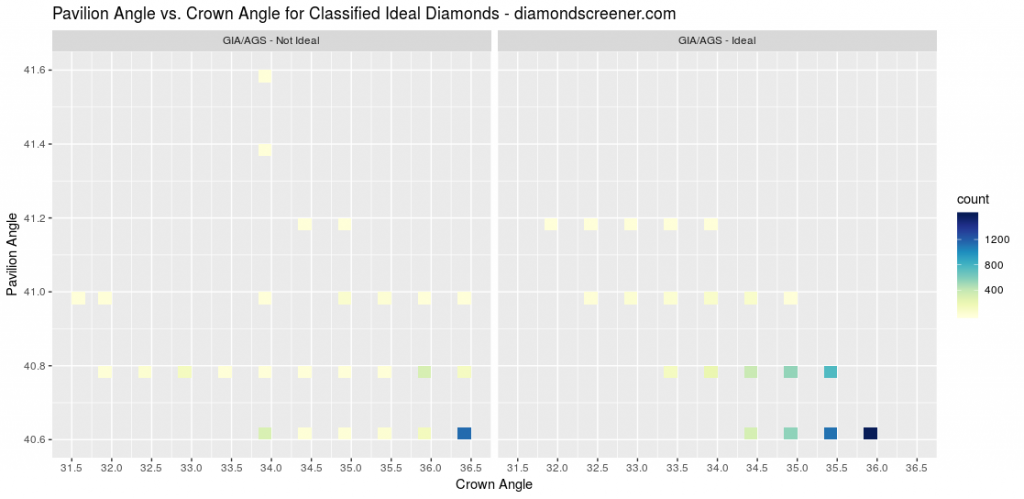
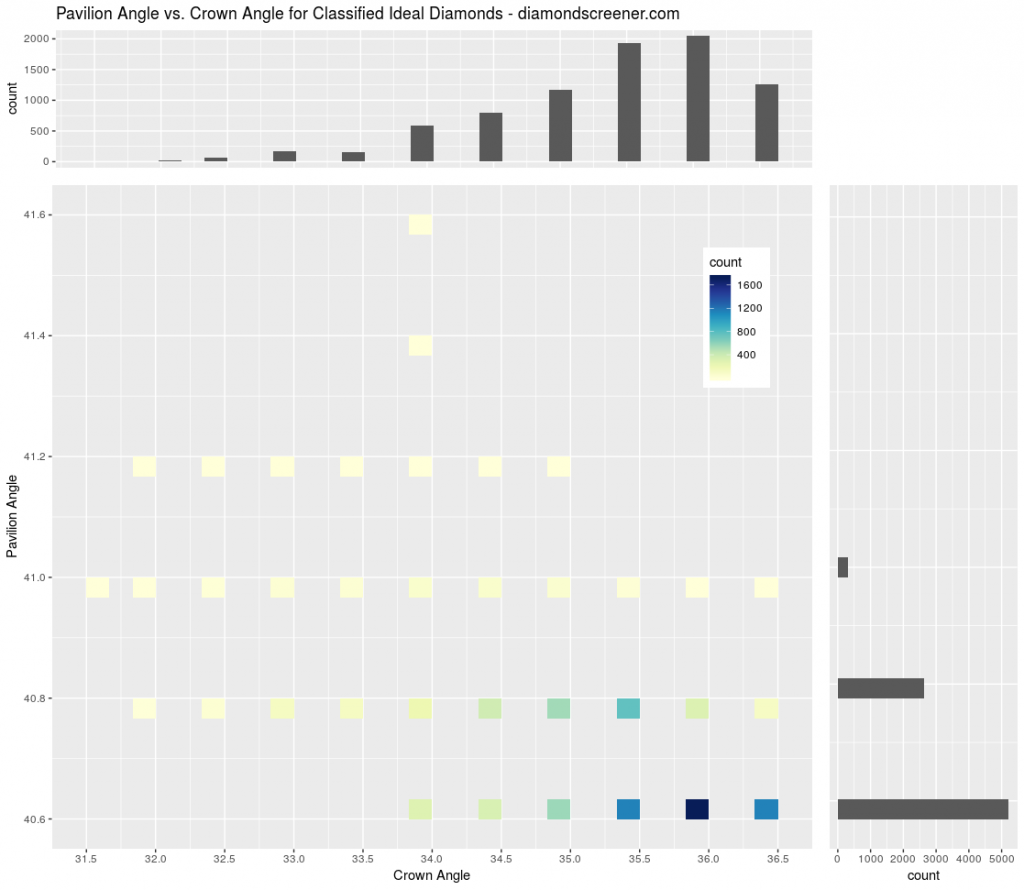
Figure 7 shows the crown/pavilion combinations for all diamonds our classifier calls ideal. The marginal distributions of crown and pavilion angles are shown on the top and right, respectively. The counts in the marginal distributions make it clear that our classifier identifies diamonds with crown angles between 34 and 36.5 and pavilion angles between 40.6 and 41.
Discussion
It’s remarkable how well an image similarity measure vs. a single image of an ideal diamond can predict ideal proportions. It demonstrates how much a diamond’s appearance depends on its proportions.
We originally split the data into a training set (75% of the data) and test set (25% of the data). The test set produced the same results as the training set, so we presented combined results here.
We used AGS 0 Ideal as “ground truth” for evaluating proportions, but there is still some room for subjectivity. Our “false positive” diamonds with 36.5/40.6, 36/40.8, and 34/40.6 crown/pavilion angle combinations typically show stronger arrows and have better optical symmetry compared to the “true positive” AGS 0 Ideal diamonds with 41.4 and 41.6 pavilion angles that our classifier ignores.
Another potential benefit of an image-similarity based classifier is that it will enrich for cleaner SI1 and SI2 diamonds. Larger inclusions should reduce image similarity compared to a clean ideal image. However, this effect is anecdotal because inclusions are difficult to quantify.
Our image similarity analysis is made possible by the quality of James Allen’s photography. The uniform background, lighting, and angles of their images enable a consistent comparison across diamonds. James Allen’s photography is also diagnostic in the sense that their images will show contrasting arrows if the diamond is well-cut. This type of analysis would fail on the more heterogeneous diamond images found on other vendor sites.
We have developed a computer vision-based diamond classifier to mimic the judgment of a human eye. We are confident its results will improve the diamond search process. Please try it for yourself – the ideal diamonds are highlighted by default in our price curves.